
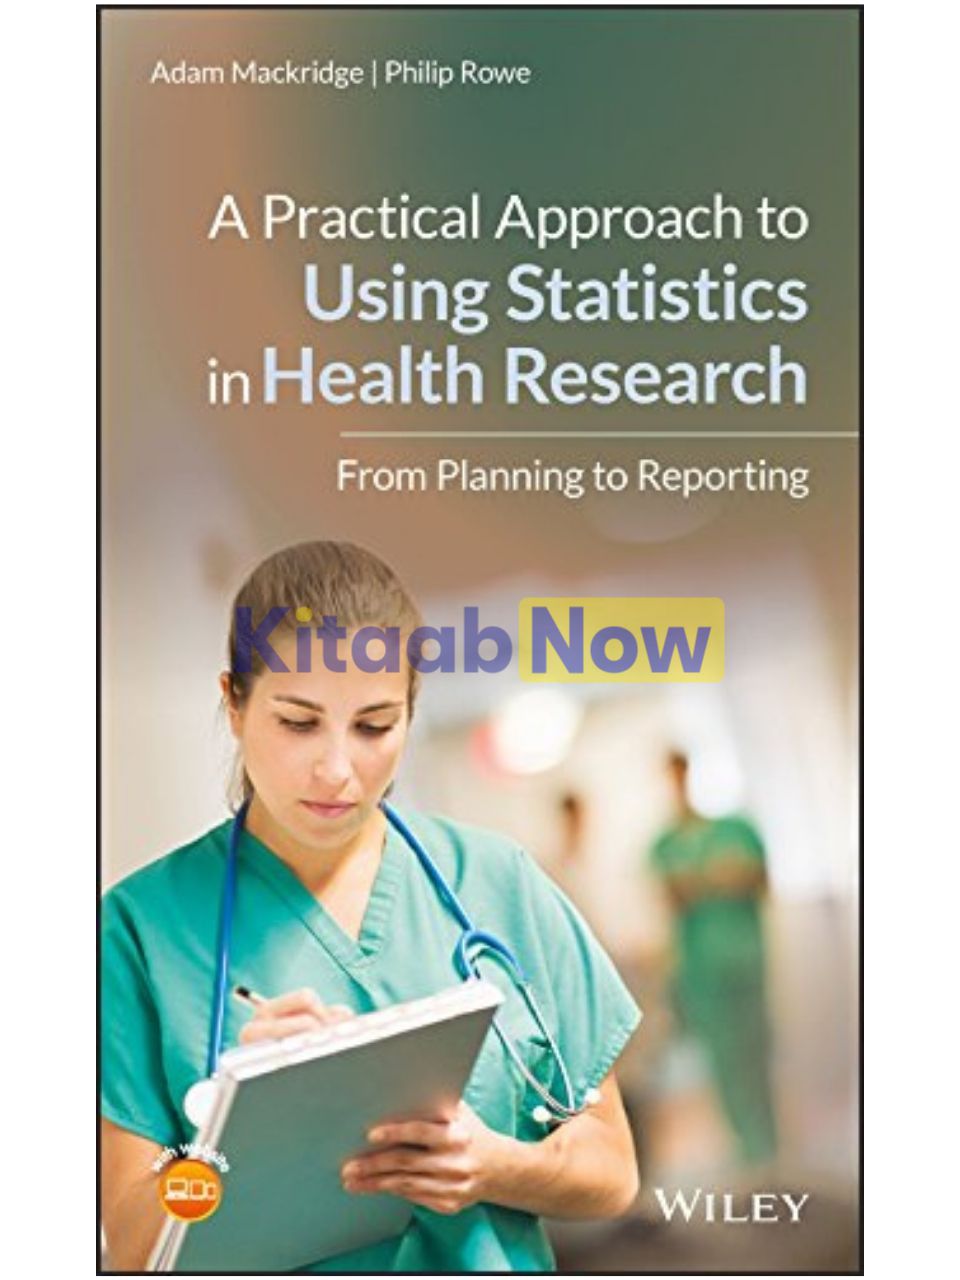
A Practical Approach to Using Statistics in Health Research: From Planning to Reporting
- Authors: Adam Mackridge, Philip Rowe
- ISBN: 9781119383574
- Publisher: John Wiley and Sons Ltd
- Publication Date: June 08, 2018
- Format: Hardback – 240 pages
- Language: English
Description
A Practical Approach to Using Statistics in Health Research offers an easy to use, step-by-step guide for using statistics in health research. The authors use their experience of statistics and health research to explain how statistics fit in to all stages of the research process. They explain how to determine necessary sample sizes, interpret whether there are statistically significant difference in outcomes between groups, and use measured effect sizes to decide whether any changes are large enough to be relevant to professional practice.
The text walks you through how to identify the main outcome measure for your study and the factor which you think may influence that outcome and then determine what type of data will be used to record both of these. It then describes how this information is used to select the most appropriate methods to report and analyze your data. A step-by-step guide on how to use a range of common statistical procedures are then presented in separate chapters. To help you make sure that you are using statistics robustly, the authors also explore topics such as multiple testing and how to check whether measured data follows a normal distribution. Videos showing how to use computer packages to carry out all the various methods mentioned in the book are available on our companion web site. This book:
- Covers statistical aspects of all the stages of health research from planning to final reporting
- Explains how to report statistical planning, how analyses were performed, and the results and conclusion
- Puts the spotlight on consideration of clinical significance and not just statistical significance
- Explains the importance of reporting 95% confidence intervals for effect size
- Includes a systematic guide for selection of statistical tests and uses example data sets and videos to help you understand exactly how to use statistics
Written as an introductory guide to statistics for healthcare professionals, students and lecturers in the fields of pharmacy, nursing, medicine, dentistry, physiotherapy, and occupational therapy, A Practical Approach to Using Statistics in Health Research:From Planning to Reporting is a handy reference that focuses on the application of statistical methods within the health research context.
Table of Contents
- Introduction 1
- At Whom is This Book Aimed? 1
- At What Scale of Project is This Book Aimed? 2
- Why Might This Book be Useful for You? 2
- How to Use This Book 3
- Computer Based Statistics Packages 4
- Relevant Videos etc. 5
- Data Types 7
- What Types of Data are There and Why Does it Matter? 7
- Continuous Measured Data 7
- Continuous Measured Data – Normal and Non‐Normal Distribution 8
- Transforming Non‐Normal Data 13
- Ordinal Data 13
- Categorical Data 14
- Ambiguous Cases 14
- A Continuously Varying Measure that has been Divided into a Small Number of Ranges 14
- Composite Scores with a Wide Range of Possible Values 15
- Relevant Videos etc. 15
- Presenting and Summarizing Data 17
- Continuous Measured Data 17
- Normally Distributed Data – Using the Mean and Standard Deviation 18
- Data With Outliers, e.g. Skewed Data – Using Quartiles and the Median 18
- Polymodal Data – Using the Modes 20
- Ordinal Data 21
- Ordinal Scales With a Narrow Range of Possible Values 22
- Ordinal Scales With a Wide Range of Possible Values 22
- Dividing an Ordinal Scale Into a Small Number of Ranges (e.g. Satisfactory/Unsatisfactory or Poor/Acceptable/Good) 22
- Summary for Ordinal Data 23
- Categorical Data 23
- Relevant Videos etc. 24
- Appendix 1: An Example of the Insensitivity of the Median When Used to Describe Data from an Ordinal Scale With a Narrow Range of Possible Values 25
- Choosing a Statistical Test 27
- Identify the Factor and Outcome 27
- Identify the Type of Data Used to Record the Relevant Factor 29
- Statistical Methods Where the Factor is Categorical 30
- Identify the Type of Data Used to Record the Outcome 30
- Is Continuous Measured Outcome Data Normally Distributed or Can It Be Transformed to Normality? 30
- Identify Whether Your Sets of Outcome Data Are Related or Independent 31
- For the Factor, How Many Levels Are Being Studied? 32
- Determine the Appropriate Statistical Method for Studies with a Categorical Factor 32
- Correlation and Regression with a Measured Factor 34
- What Type of Data Was Used to Record Your Factor and Outcome? 34
- When Both the Factor and the Outcome Consist of Continuous Measured Values, Select Between Pearson and Spearman Correlation 34
- Relevant Additional Material 38
- Multiple Testing 39
- What Is Multiple Testing and Why Does It Matter? 39
- What Can We Do to Avoid an Excessive Risk of False Positives? 40
- Use of Omnibus Tests 40
- Distinguishing Between Primary and Secondary/ Exploratory Analyses 40
- Bonferroni Correction 41
- Common Issues and Pitfalls 43
- Determining Equality of Standard Deviations 43
- How Do I Know, in Advance, How Large My SD Will Be? 43
- One‐Sided Versus Two‐Sided Testing 44
- Pitfalls That Make Data Look More Meaningful Than It Really Is 45
- Too Many Decimal Places 45
- Percentages with Small Sample Sizes 47
- Discussion of Statistically Significant Results 47
- Discussion of Non‐Significant Results 50
- Describing Effect Sizes with Non‐Parametric Tests 51
- Confusing Association with a Cause and Effect Relationship 52
- Contingency Chi‐Square Test 55
- When Is the Test Appropriate? 55
- An Example 55
- Presenting the Data 57
- Contingency Tables 57
- Clustered or Stacked Bar Charts 57
- Data Requirements 59
- An Outline of the Test 59
- Planning Sample Sizes 59
- Carrying Out the Test 60
- Special Issues 61
- Yates Correction 61
- Low Expected Frequencies – Fisher’s Exact Test 61
- Describing the Effect Size 61
- Absolute Risk Difference (ARD) 62
- Number Needed to Treat (NNT) 63
- Risk Ratio (RR) 63
- Odds Ratio (OR) 64
- Case: Control Studies 65
- How to Report the Analysis 65
- Methods 65
- Results 66
- Discussion 67
- Confounding and Logistic Regression 67
- Reporting the Detection of Confounding 68
- Larger Tables 69
- Collapsing Tables 69
- Reducing Tables 70
- Relevant Videos etc. 71
- Independent Samples (Two‐Sample) T‐Test 73
- When Is the Test Applied? 73
- An Example 73
- Presenting the Data 75
- Numerically 75
- Graphically 75
- Data Requirements 75
- Variables Required 75
- Normal Distribution of the Outcome Variable Within the Two Samples 75
- Equal Standard Deviations 78
- Equal Sample Sizes 78
- An Outline of the Test 78
- Planning Sample Sizes 79
- Carrying Out the Test 79
- Describing the Effect Size 79
- How to Describe the Test, the Statistical and Practical Significance of Your Findings in Your Report 80
- Methods Section 80
- Results Section 80
- Discussion Section 81
- Relevant Videos etc. 81
- Mann–Whitney Test 83
- When Is the Test Applied? 83
- An Example 83
- Presenting the Data 85
- Numerically 85
- Graphically 85
- Divide the Outcomes into Low and High Ranges 85
- Data Requirements 86
- Variables Required 86
- Normal Distributions and Equality of Standard Deviations 87
- Equal Sample Sizes 87
- An Outline of the Test 87
- Statistical Significance 87
- Planning Sample Sizes 87
- Carrying Out the Test 88
- Describing the Effect Size 88
- How to Report the Test 89
- Methods Section 89
- Results Section 89
- Discussion Section 90
- Relevant Videos etc. 91
- One‐Way Analysis of Variance (ANOVA) – Including Dunnett’s and Tukey’s Follow Up Tests 93
- When Is the Test Applied? 93
- An Example 93
- Presenting the Data 94
- Numerically 94
- Graphically 94
- Data Requirements 94
- Variables Required 94
- Normality of Distribution for the Outcome Variable Within the Three Samples 95
- Standard Deviations 96
- Sample Sizes 98
- An Outline of the Test 98
- Follow Up Tests 98
- Planning Sample Sizes 99
- Carrying Out the Test 100
- Describing the Effect Size 101
- How to Report the Test 101
- Methods 101
- Results Section 102
- Discussion Section 102
- Relevant Videos etc. 103
- Kruskal–Wallis 105
- When Is the Test Applied? 105
- An Example 105
- Presenting the Data 106
- Numerically 106
- Graphically 107
- Data Requirements 109
- Variables Required 109
- Normal Distributions and Standard Deviations 109
- Equal Sample Sizes 110
- An Outline of the Test 110
- Planning Sample Sizes 110
- Carrying Out the Test 110
- Describing the Effect Size 111
- Determining Which Group Differs from Which Other 111
- How to Report the Test 111
- Methods Section 111
- Results Section 112
- Discussion Section 113
- Relevant Videos etc. 114
- McNemar’s Test 115
- When Is the Test Applied? 115
- An Example 115
- Presenting the Data 116
- Data Requirements 116
- An Outline of the Test 118
- Planning Sample Sizes 118
- Carrying Out the Test 119
- Describing the Effect Size 119
- How to Report the Test 119
- Methods Section 119
- Results Section 120
- Discussion Section 120
- Relevant Videos etc. 121
- Paired T‐Test 123
- When Is the Test Applied? 123
- An Example 125
- Presenting the Data 125
- Numerically 125
- Graphically 125
- Data Requirements 126
- Variables Required 126
- Normal Distribution of the Outcome Data 126
- Equal Standard Deviations 128
- Equal Sample Sizes 128
- An Outline of the Test 128
- Planning Sample Sizes 129
- Carrying Out the Test 129
- Describing the Effect Size 129
- How to Report the Test 130
- Methods Section 130
- Results Section 130
- Discussion Section 131
- Relevant Videos etc. 131
- Wilcoxon Signed Rank Test 133
- When Is the Test Applied? 133
- An Example 134
- Presenting the Data 134
- Numerically 134
- Graphically 136
- Data Requirements 136
- Variables Required 136
- Normal Distributions and Equal Standard Deviations 137
- Equal Sample Sizes 137
- An Outline of the Test 137
- Planning Sample Sizes 138
- Carrying Out the Test 139
- Describing the Effect Size 139
- How to Report the Test 140
- Methods Section 140
- Results Section 140
- Discussion Section 141
- Relevant Videos etc. 141
- Repeated Measures Analysis of Variance 143
- When Is the Test Applied? 143
- An Example 144
- Presenting the Data 144
- Numerical Presentation of the Data 145
- Graphical Presentation of the Data 145
- Data Requirements 146
- Variables Required 146
- Normal Distribution of the Outcome Data 148
- Equal Standard Deviations 148
- Equal Sample Sizes 148
- An Outline of the Test 148
- Planning Sample Sizes 149
- Carrying Out the Test 150
- Describing the Effect Size 150
- How to Report the Test 151
- Methods Section 151
- Results Section 151
- Discussion Section 152
- Relevant Videos etc. 153
- Friedman Test 155
- When Is the Test Applied? 15516.2
- An Example 157
- Presenting the Data 157
- Bar Charts of the Outcomes at Various Stages 157
- Summarizing the Data via Medians or Means 157
- Splitting the Data at Some Critical Point in the Scale 159
- Data Requirements 160
- Variables Required 160
- Normal Distribution and Standard Deviations in the Outcome Data 160
- Equal Sample Sizes 160
- An Outline of the Test 160
- Planning Sample Sizes 161
- Follow Up Tests 161
- Carrying Out the Tests 162
- Describing the Effect Size 162
- Median or Mean Values Among the Individual Changes 162
- Split the Scale 162
- How to Report the Test 162
- Methods Section 162
- Results Section 163
- Discussion Section 164
- Relevant Videos etc. 164
- Pearson Correlation 165
- Presenting the Data 165
- Correlation Coefficient and Statistical Significance 166
- Planning Sample Sizes 167
- Effect Size and Practical Relevance 167
- Regression 169
- How to Report the Analysis 170
- Methods 170
- Results 170
- Discussion 171
- Relevant Videos etc. 171
- Spearman Correlation 173
- Presenting the Data 173
- Testing for Evidence of Inappropriate Distributions 174
- Rho and Statistical Significance 174
- An Outline of the Significance Test 175
- Planning Sample Sizes 175
- Effect Size 176
- Where Both Measures Are Ordinal 176
- Educational Level and Willingness to Undertake Internet Research – An Example Where Both Measures Are Ordinal 176
- Presenting the Data 177
- Rho and Statistical Significance 177
- Effect Size 178
- How to Report Spearman Correlation Analyses 178
- Methods 178
- Results 179
- Discussion 180
- Relevant Videos etc. 180
- Logistic Regression 181
- Use of Logistic Regression with Categorical Outcomes 181
- An Outline of the Significance Test 182
- Planning Sample Sizes 182
- Results of the Analysis 184
- Describing the Effect Size 184
- How to Report the Analysis 185
- Methods 185
- Results 186
- Discussion 186
- Relevant Videos etc. 187
- Cronbach’s Alpha 189
- Appropriate Situations for the Use of Cronbach’s Alpha 18920.2
- Inappropriate Uses of Alpha 190
- Interpretation 190
- Reverse Scoring 191
- An Example 191
- Performing and Interpreting the Analysis 192
- How to Report Cronbach’s Alpha Analyses 193
- Methods Section 193
- Results 194
- Discussion 194
- Relevant Videos etc. 195
- Glossary 197
- Videos 209
- Index 211
Author Biography
Adam Mackridge, Ph.D., is a Research Pharmacist at Betsi Cadwaladr University Health Board in North Wales. He has over 15 years of experience in planning, conducting and reporting health research. He received his PhD in Pharmacy Practice from Aston University in Birmingham, UK.
Philip Rowe, Ph.D., is a Visiting Research Fellow in the School of Pharmacy and Molecular Sciences at Liverpool John Moores University, Liverpool, UK. He is a Fellow of the Royal Statistical Society and has authored other statistically based books for Wiley.
Additional information
| Weight | 0.474 kg |
|---|
Only logged in customers who have purchased this product may leave a review.
Related Products




Reviews
There are no reviews yet.